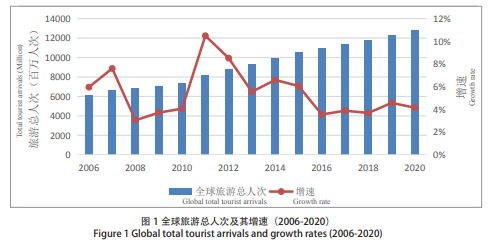
Global tourist arrivals rose 4.6% to 12.310 billion in 2019, according to the Report on World Tourism Economy Trends (2020) jointly released by World Tourism Cities Federation and the Tourism Research Centre of Chinese Academy of Social Sciences.
Compared with 2018, the growth rate rose by 0.9 percentage point, showing decelerating growth. It is estimated that the global tourist arrivals will reach 12.821 billion in 2020, with a growth rate of 4.2%, 0.4 percentage point lower than that in 2019.
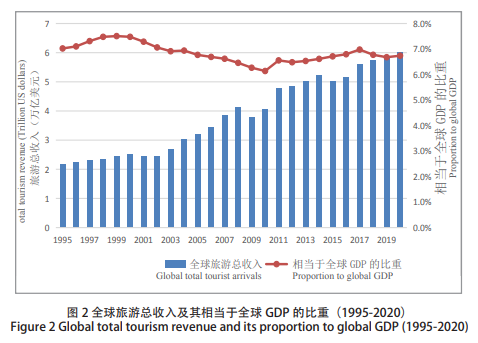
The 2019 global tourism revenue reached 5.8 trillion US dollars, equivalent to 6.7% of global GDP, with a decrease of 0.1% over the previous year. The global tourism revenue will reach 6.02 trillion US dollars in 2020, equivalent to 6.8% of global GDP, with a slight increase from 2019.
Global inbound tourist arrivals reached 1.371 billion in 2019, with a growth rate of 3.4% compared with the previous year, which was 0.5 percentage point lower than that in 2018. It is estimated that the global inbound tourist arrivals will reach 1.423 billion in 2020, with a growth rate of 3.8%.
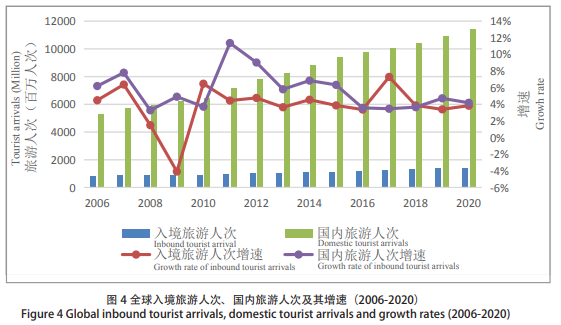
Global domestic tourist arrivals reached 10.94 billion in 2019, with a growth rate of 4.7%, which was 1 percentage point higher than that in 2018. It is estimated that the global domestic tourist arrivals will reach 11.40 billion in 2020, with a growth rate of 4.2%.
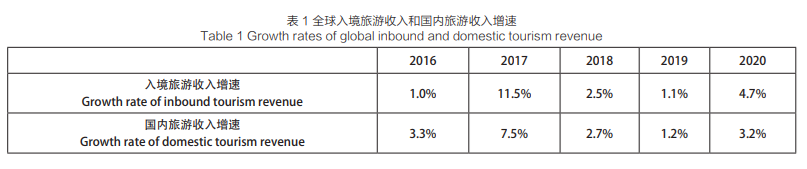
In 2019, the global inbound tourism revenue reached 1.7 trillion US dollars, with a growth rate of 1.1%, and the global domestic tourism revenue reached 4.1 trillion US dollars, with a growth rate of 1.2%; it is estimated that in 2020, the global inbound tourism revenue will reach 1.78 trillion US dollars, with a growth rate of 4.7%, and the global domestic tourism revenue will reach 4.24 trillion US dollars, with a growth rate of 3.2%. Both are expected to achieve five-year consecutive increases.
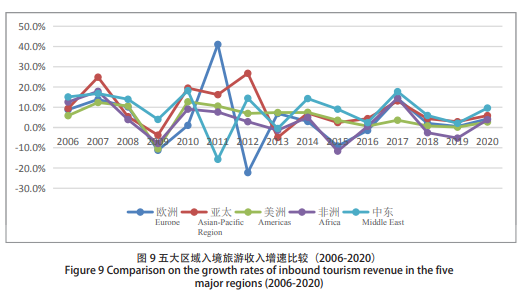
Differentiation in five major regions
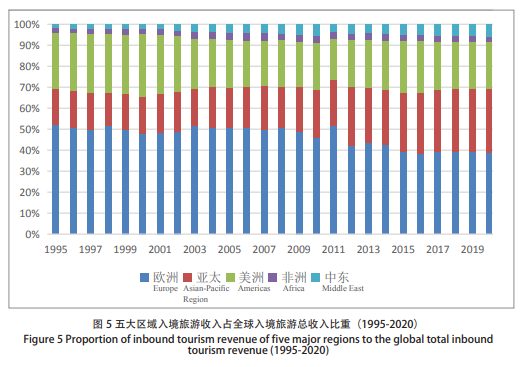
Europe: Between 1995 and 2011, the European inbound tourism revenue maintained about 50% to the global inbound tourism revenue. After 2012, the proportion of European inbound tourism revenue to the global total inbound tourism revenue showed a significant decrease compared with the previous years, 39% in 2019 and 38.9% expected in 2020.
Asia Pacific: highest growth rates in three aspects among the five major regions in the world.
First, the growth rate and stability of domestic tourist arrivals ranked first. In 2019, the domestic tourist arrivals reached 7.608 billion in the Asian-Pacific Region, with a year-on-year increase of 5.2%. It is predicted that the domestic tourist arrivals will reach 7.989 billion in the Asian-Pacific Region in 2020, with a year-on-year increase of 5.0%.
Second, the growth trend of domestic tourism revenue ranked first. In 2019, the domestic tourism revenue reached 1.6 trillion U.S. dollars in the Asian-Pacific Region, with a growth rate of 2.5%, while it is predicted that it will reach 1.7 trillion U.S. dollars in 2020, with a growth rate of 4.3%. From the perspective of long-term trend, the Asian-Pacific Region precedes the other four regions in terms of domestic tourism revenue and corresponding growth rate.
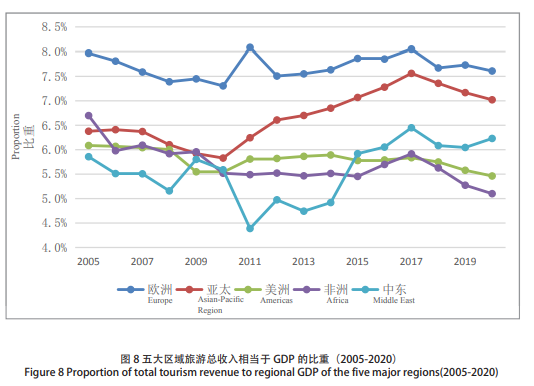
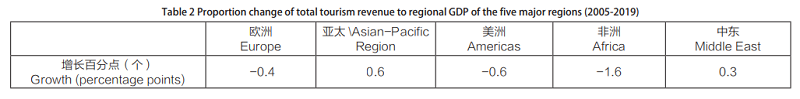
Third, the growth rate of the proportion of total tourism revenue to GDP ranked first. In Europe, the proportion of the total tourism revenue to GDP decreased from 8.0% in 2005 to 7.6% in 2019, a decrease of 0.4 percentage point; in the Asian-Pacific Region, the proportion of the tourism economy to GDP increased from 6.4% to 7.0%, an increase of 0.6 percentage point; in Americas, the figure decreased from 6.1% to 5.5%, a decrease of 0.6 percentage point; in Africa, it decreased from 6.7% to 5.1%, a decrease of 1.6 percentage point; in the Middle East, it increased from 5.9% to 6.2%, an increase of 0.3 percentage point.
Americas: The Americas has witnessed gradual declining development in the tourism industry in the long run: domestic tourist arrivals have maintained at a low growth rate for a long time. Since 2006, the Americas has maintained a growth rate of [-1.2%, 5.4%] of the domestic tourist arrivals; the inbound tourism revenue turned on a declining trend, with a growth rate of only 0.2% in 2019; the proportion of total tourism revenue to GDP was in a long-term downward trend. In 2019, this proportion decreased to 5.6%. It is estimated that, in 2020, the figure will continue to fall to 5.5%.
Africa and Middle East: Total inbound tourist arrivals of the Middle East and Africa fluctuate significantly, which is less than 1/10 of the global inbound tourist arrivals. From 2006 to 2019, for the growth rate of inbound tourist arrivals, the highest peak (19.4%, 2008) and the lowest peak (-17.6%, 2011) differed by 37 percentage points in the Middle East, while the highest peak (8.7%, 2010) and the lowest peak (-3.3%, 2015) differed by 12 percentage points in Africa.
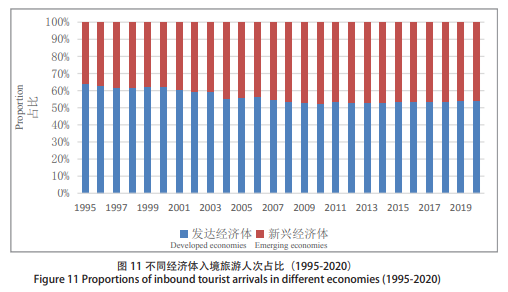
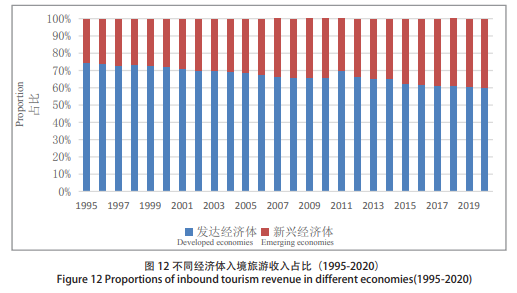
Increasing prominence of emerging economies
The proportions of inbound tourist arrivals in emerging economies closed to 50%, while inbound tourism revenue accounted for 40% approximately. In 2019, the inbound tourist arrivals in emerging economies accounted for 46.2% of the global inbound tourist arrivals, which is expected to rise to 47.4% in 2020. In 2019, the inbound tourism revenue in emerging economies accounted for 39.3% of the global total tourism revenue, which is expected to rise to 39.7% in 2020.
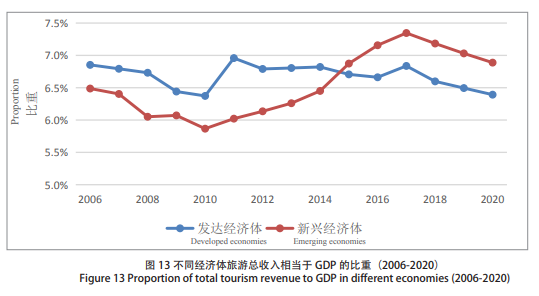
Emerging economies played a stronger role in stimulating social and economic development. In 2019, the growth rate of total tourism revenue in emerging economies was 2.0%, 1.4 percentage points higher than that in the developed economies; the proportion of total tourism revenue to GDP in emerging economies was 7.0%, 0.5 percentage point higher than that in the developed economies. It is predicted that in 2020, the growth rate of total tourism revenue in emerging economies will rise to 4.7%, 1.9 percentage points higher than that in the developed economies; the proportion of total tourism revenue to GDP in emerging economies was 6.9%, 0.5 percentage point higher than the developed economies.
Highly concentrated in T20 countries
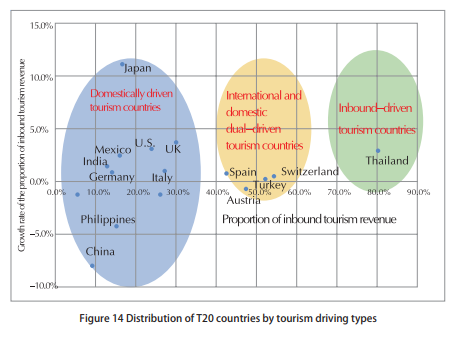
The top 20 countries by total tourism revenue in the world are referred to by the research group as T20 countries. In general, 80% of the global tourism economy is concentrated in T20 countries. Domestic tourism is the pillar of T20 countries’ tourism economy, and tourism has promoted the economic development of T20 countries.
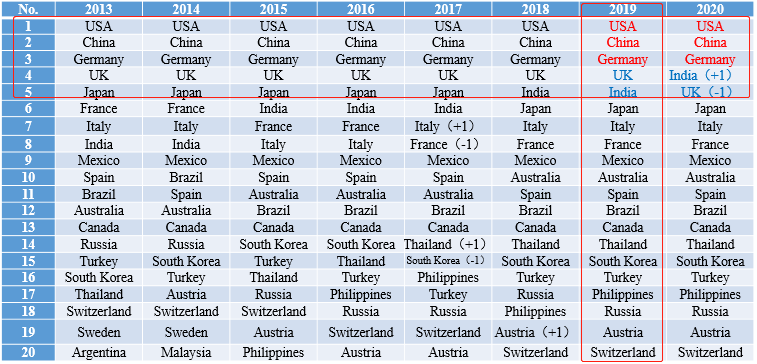
By the proportion of inbound tourism revenue to the total tourism revenue and the annual average growth rate of The proportion of inbound tourism revenue to the total tourism revenue, T20 countries can be divided into inbound-driven tourism countries, international and domestic dual-driven tourism countries (driven by domestic tourism and inbound tourism) and domestically driven tourism countries.
Different trends presented by T20 countries
Based on the analysis, the tourism development trend of T20 countries may be divided into the following four types: the first type is “steady growth at a low speed”, represented by the United States (the U.S.); the second type is “slow growth with speed reduced”, represented by China, India and the Philippines; the third type is “alternate positive and negative growth”, represented by Germany, Japan, UK, Italy and Brazil; and the fourth is “revenue fluctuation”, represented by France, Mexico, Australia, Spain, Canada, South Korea, Turkey and Russia.
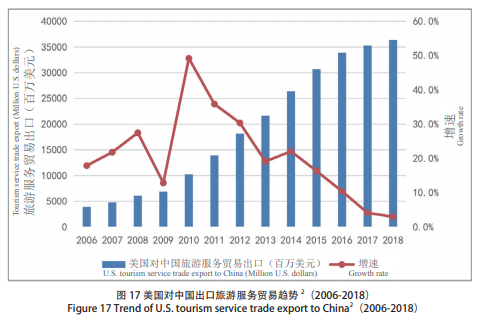
Tourism service trade & global service trade
The U.S. and China are ranked first and second among service trade exporters and tourism service trade exporters. The UK, Germany, France, Japan, Italy, India, Mexico and Spain are also important exporters of service trade and tourism service trade.
The development of Sino-U.S. tourism service trade has been affected by trade frictions provoked by the U.S. in recent years. In 2017, the U.S. tourism service trade export to China was 35.5 billion U.S. dollars, with a year-on-year growth rate of 4.1%, 6.3 percentage points lower than that in 2016. In this year, the growth rate declined to less than 10% for the first time for over a decade. In 2018, the figure continued to decline to 3.0%.In 2018, the number of U.S. tourist arrivals from China showed a negative growth for the first time, with the growth rate down to -6.0%.
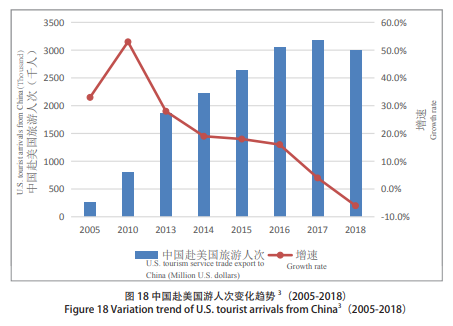
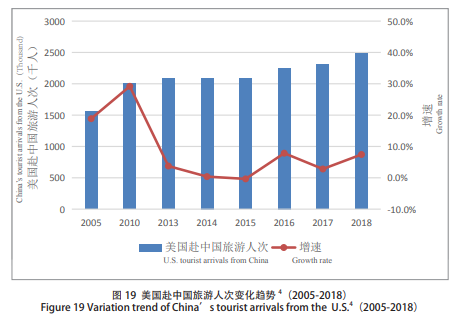
However, it seemed that the Sino-U.S. trade frictions did not affect the variation of China’s tourist arrivals from the U.S. and statistics show that the growth rate of China’s tourist arrivals from the U.S. reached 7.4% in 2018, 4.6 percentage points higher than that in 2017 (2.8%).
Geopolitical risks, trade friction risks, regional social conflicts and other uncertainties will continue to be important factors hindering the development of tourism economy in 2020. Although the goal of Brexit is clear, the progress is still unclear. Although Sino-U.S. trade friction tends to ease, the prospect is still uncertain. Various social contradictions and conflicts exist in many regions, bringing many challenges to the growth of the global tourism economy.
Considering the rigid tourism demand, the resilience of tourism development and the importance that all countries attached to tourism development, it is estimated that the growth rate of global tourism economy in 2020 will be 3.6%, 2.4 percentage points higher than that in 2019, of which the growth rate of inbound tourism revenue will reach 4.7%, 3.6 percentage points higher than that in 2019. The slight growth of the global tourism economy will mainly depend on the Asia-Pacific Region and emerging economies,China’s total tourism revenue growth rate is expected to reach 6.1% in 2020, 0.7 percentage point higher than that in 2019.