There’s an old saying aircraft only earn money when they are in the air and it’s true, although it is not quite as simple as that. For both airports and airlines, understanding operational performance in its minutest detail - and shaving minutes or even seconds off an aircraft’s turnaround - can save thousands of dollars over the course of a year.
Turnaround for Airports…
Operational efficiency can be increased at airports by moving aircraft away from valuable gates swiftly, preventing the need for more gates in the long-term, and in the short-term it reduces bussing operations, with a subsequent saving on carbon emissions.
Turnaround for Airlines…
By reducing an aircraft turnaround by ten minutes four times a day, airlines have the opportunity of 40 more minutes flying, or revenue-earning potential per day; multiply that by a year’s flying and it could increase the revenue opportunity for airlines. Suddenly you can see why all the interest; indeed, one major London airport worked with a major F1 operations team to analyze and improve turnaround times.
Chasing the Plane
At OAG we not only track on-time performance across the world’s airlines, but we also track the aircraft registration and manufacturer’s serial number (where available) giving us a microscopic level of detail around how an airline’s fleet is being used, where the aircraft are, and what they are doing at any one time. It’s fascinating flight data that allows us to look at operational data in various ways, and turnaround times are a great area for analysis. Yes, it’s almost geeky!
For March we have tracked the turnaround times of the major US carriers to understand how they have performed against their scheduled turnaround times at their respective hub airports and by specific aircraft types, and as you would expect some airlines and airports are better than others. The planned average turnaround times for the US majors ranged from 52 minutes in the case of Southwest to 68 minutes for United Airlines, with all six airlines reporting average actual turnaround times of between 59 minutes (Southwest) and 77 in the case of Delta Air Lines.
None of the US majors managed to turn around their aircraft within the planned timeframes, United Airlines were the closest with an average of six minutes’ difference between planned and actuals - which doesn’t seem very much but looked at another way is nearly 10% longer than planned. JetBlue had the longest variance at 12 minutes or an average 19% variance.
Average Turnaround Times US Majors, March 2023
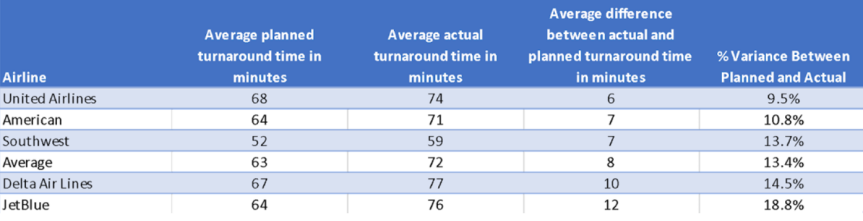
Source: OAG Flight Status Data
Analysis of each individual airline at some of their selected base airports shows that United Airlines had a particularly good March with the average turnaround delay in San Francisco at just 4 minutes, the lowest reported across the sample and just 5% longer than planned. Even at United’s worst-performing airport analyzed, New York Newark, the average delay was 10 minutes as the table below highlights, or just 15% later than planned.
United Airlines Average Turnaround Times At Selected Airports, March 2023
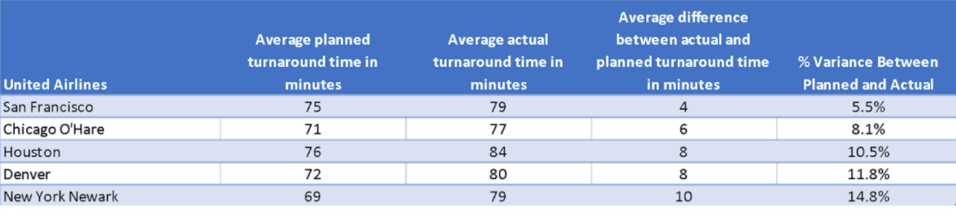
Source: OAG Flight Status Data
At the other end of the spectrum, March was not a great month for JetBlue, at least in terms of turnaround performance, with the percentage variance against planned turnaround ranging from 17% to 25% across the observed bases. In Orlando, JetBlue incurred an average delay of 16 minutes or 25% against planned time - the highest across the five airlines sampled.